Trading Blog

Insights, strategies, and guides to help you trade smarter.

KEEL Chart Watch: Which Levels Define the Setup?
Trading

KEEL Chart Watch: Which Levels Define the Setup?

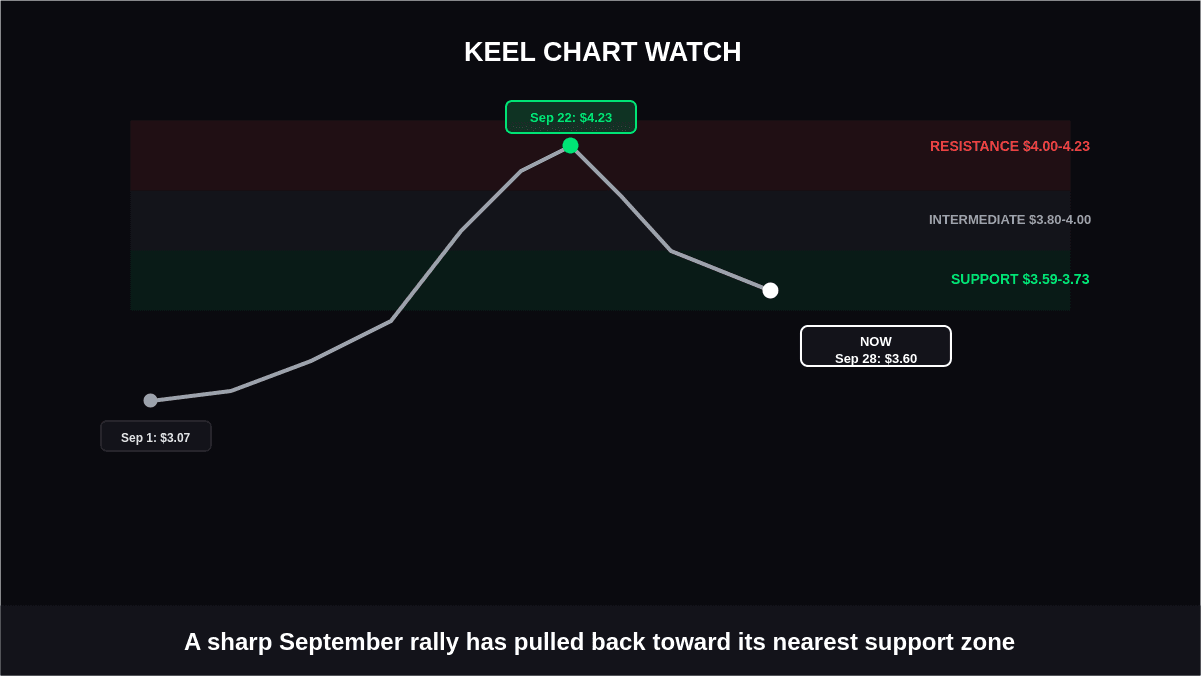
The KEEL chart is currently showing a clear battle between a recent recovery and renewed selling pressure. Keel Infrastructure Corp. (NASDAQ: KEEL) closed at about $3.60 on September 28, 2026, following several sessions of declines after reaching an intraday high of $4.23 on September 22.

October 1, 2026
Read more
What Is a Limit Up and Limit Down Rule? Know the Difference
Trading

What Is a Limit Up and Limit Down Rule? Know the Difference

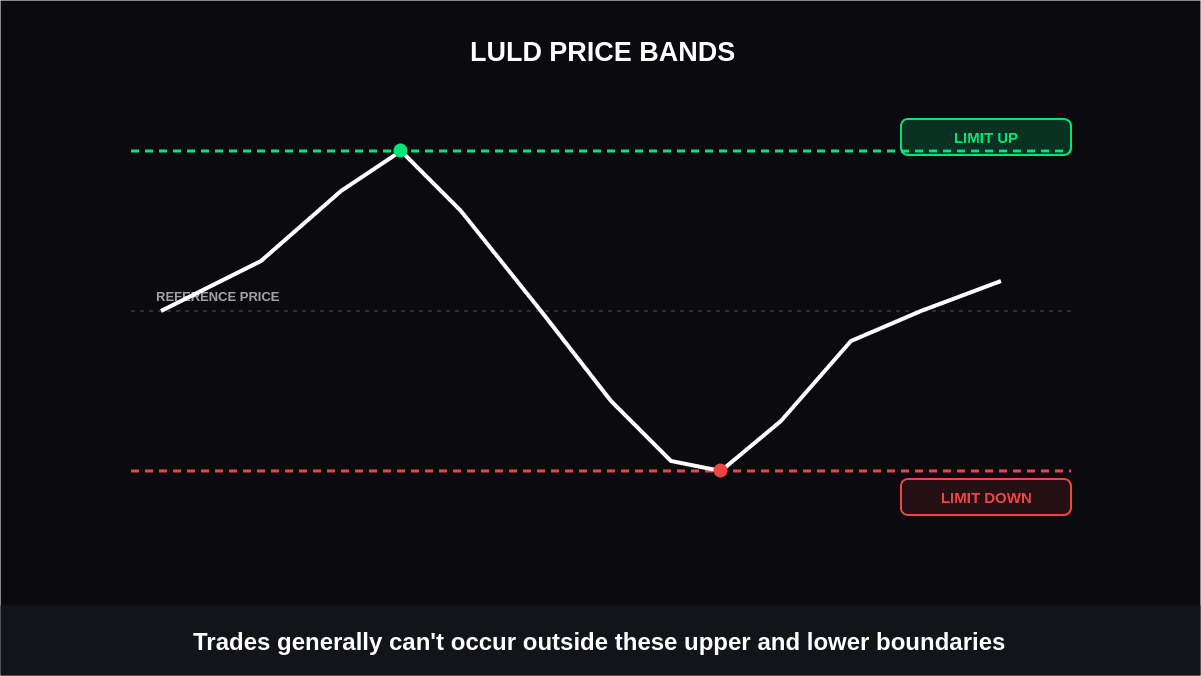
Sharp price movements can create difficult trading conditions, particularly when a stock moves rapidly within a short period. The Limit Up and Limit Down Rule is designed to help moderate these extreme moves by restricting trades outside defined price bands. Instead of allowing an individual stock to continue moving without a temporary boundary, the system establishes upper and lower limits based on recent trading activity.

October 1, 2026
Read more
IREN Breakout Watch: What Levels Matter Next?
Trading

IREN Breakout Watch: What Levels Matter Next?

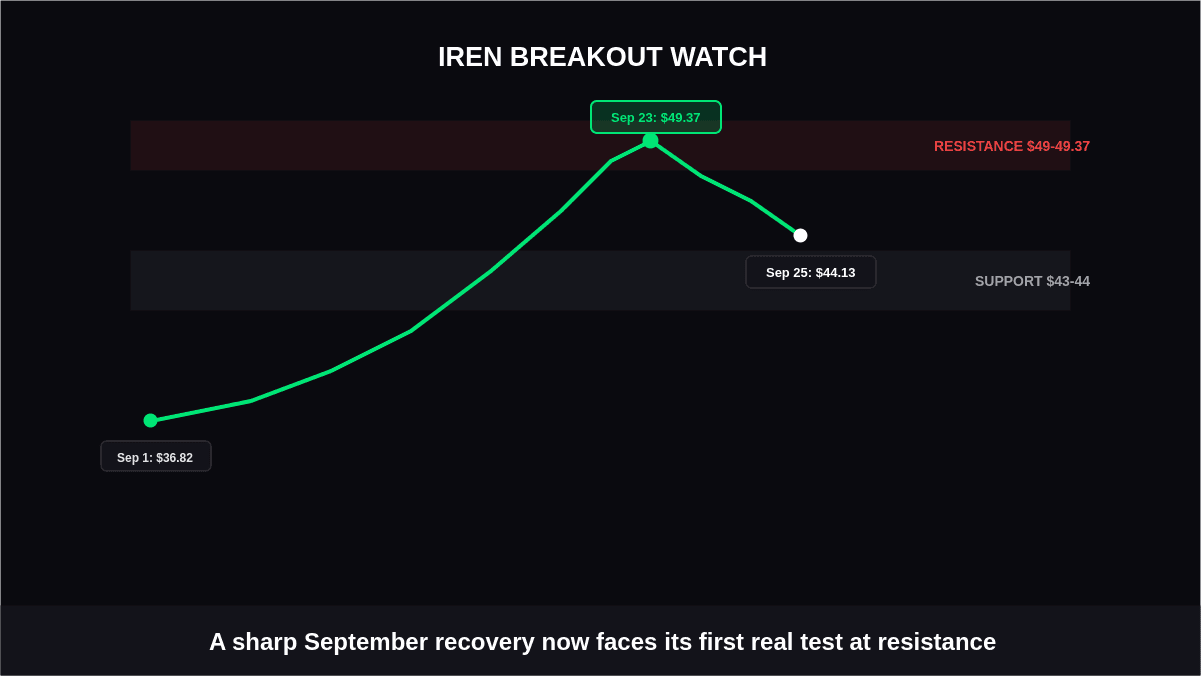
The IREN breakout setup has attracted attention after a sharp September recovery pushed the stock from a September 1 close of $36.82 to an intramonth high of $49.37 on September 23. The move has since cooled, with IREN closing at $44.13 on September 25, leaving traders watching whether the recent advance can regain its momentum or whether the stock needs to establish another base first.

October 1, 2026
Read more
Alpha vs Beta in Trading: Understanding the Difference
Trading

Alpha vs Beta in Trading: Understanding the Difference

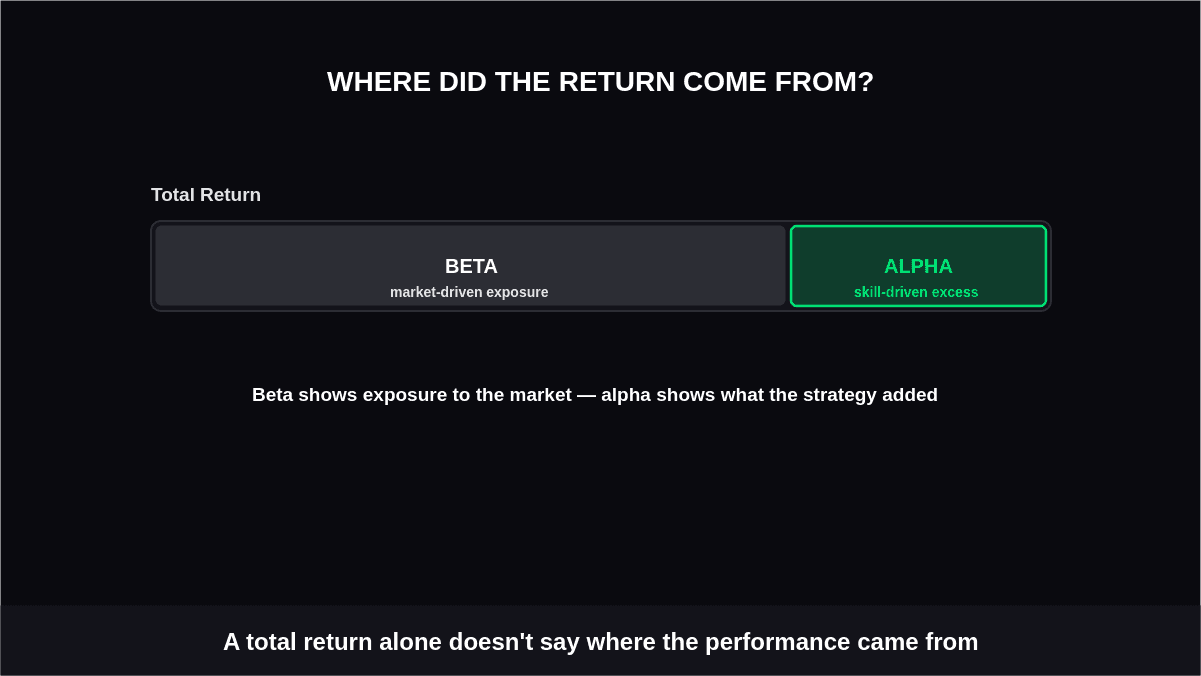
Understanding why a trading strategy performs differently from the broader market requires more than simply looking at its total return. Two concepts that can add useful context are alpha and beta. Alpha vs Beta in Trading helps explain the difference between performance that goes beyond a benchmark and returns that are influenced by broader market movements.

September 30, 2026
Read more
GainzAlgo vs Manual Buy Sell Signal Analysis
Trading

GainzAlgo vs Manual Buy Sell Signal Analysis

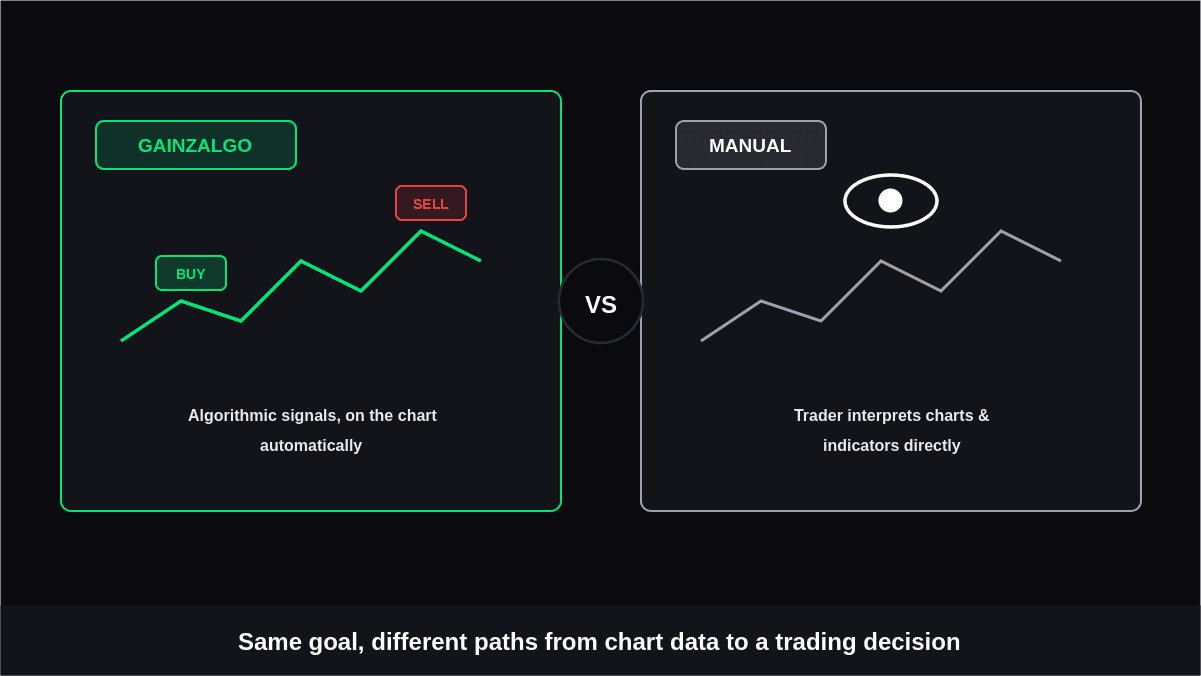
Analyzing when to enter or exit a trade can become complicated when traders have to examine charts, indicators, price action, and market conditions on their own. Buy Sell Signal Analysis provides a structured way to examine potential entry and exit opportunities, but the process can differ significantly depending on whether signals are assessed manually or with a dedicated trading system.

September 30, 2026
Read more
How to Read Market Structure Using GainzAlgo Charts
Trading

How to Read Market Structure Using GainzAlgo Charts

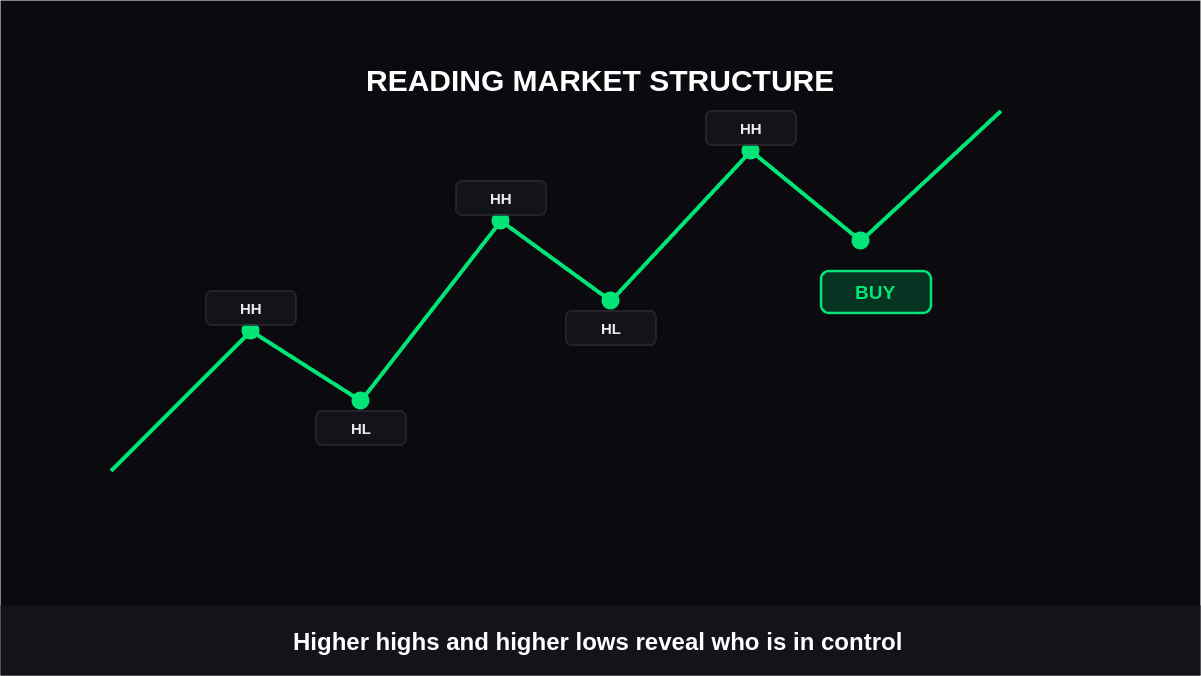
Market structure helps traders understand how price is behaving instead of relying on individual signals in isolation. To Read Market Structure, traders need to examine swing points, trend direction, breaks in price behavior, and the relationship between recent highs and lows. GainzAlgo charts can add another layer of information by displaying buy and sell signals alongside the price action, helping traders study where potential market opportunities appear.

September 29, 2026
Read more
Previous

Page 1 of 26

Next