Trading
Double Bottom Pattern: How to Identify, Confirm, and Trade the W Reversal
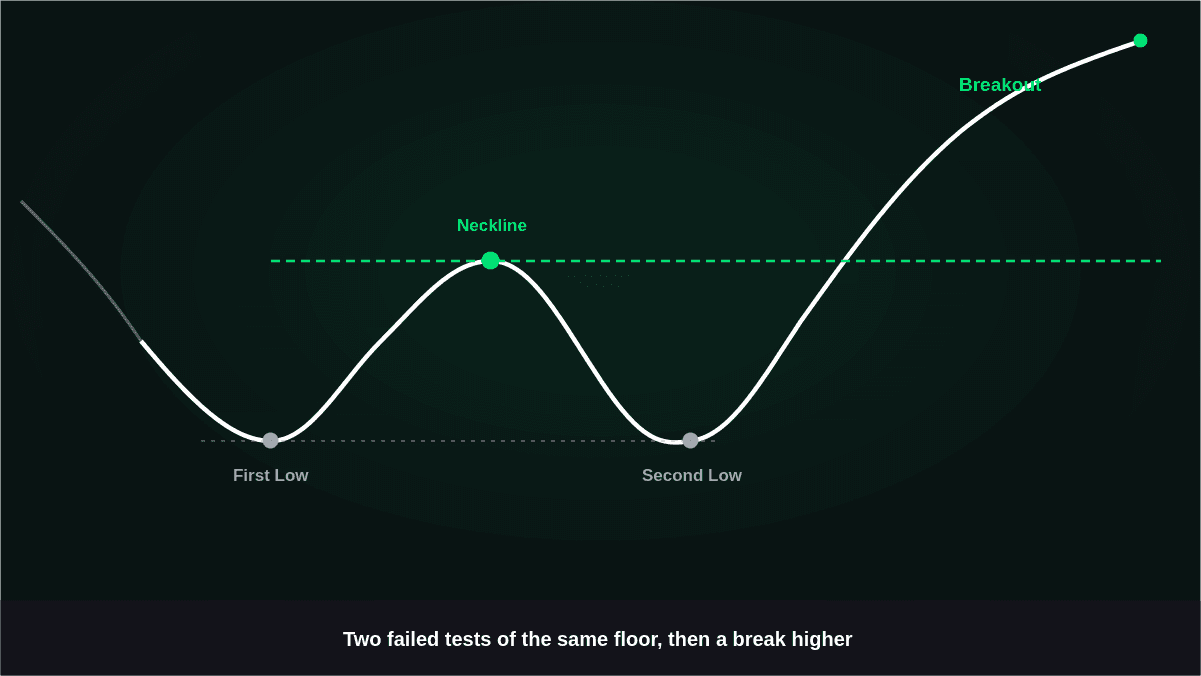
If you've spent any time reading price charts, you've probably seen it: a downtrend that drops to a low, bounces, falls back to almost the same level, and then reverses hard to the upside. That's a double bottom pattern, one of the most recognizable bullish reversal setups in technical analysis, and one of the few chart patterns with decades of statistical study behind it.
September 7, 2026